Live Sugar Pricing Index
Evaluate price trends across different continents and cities.
Nairobi
Kenya
1240$/MT
1M
Kigali
Rwanda
1160$/MT
1M
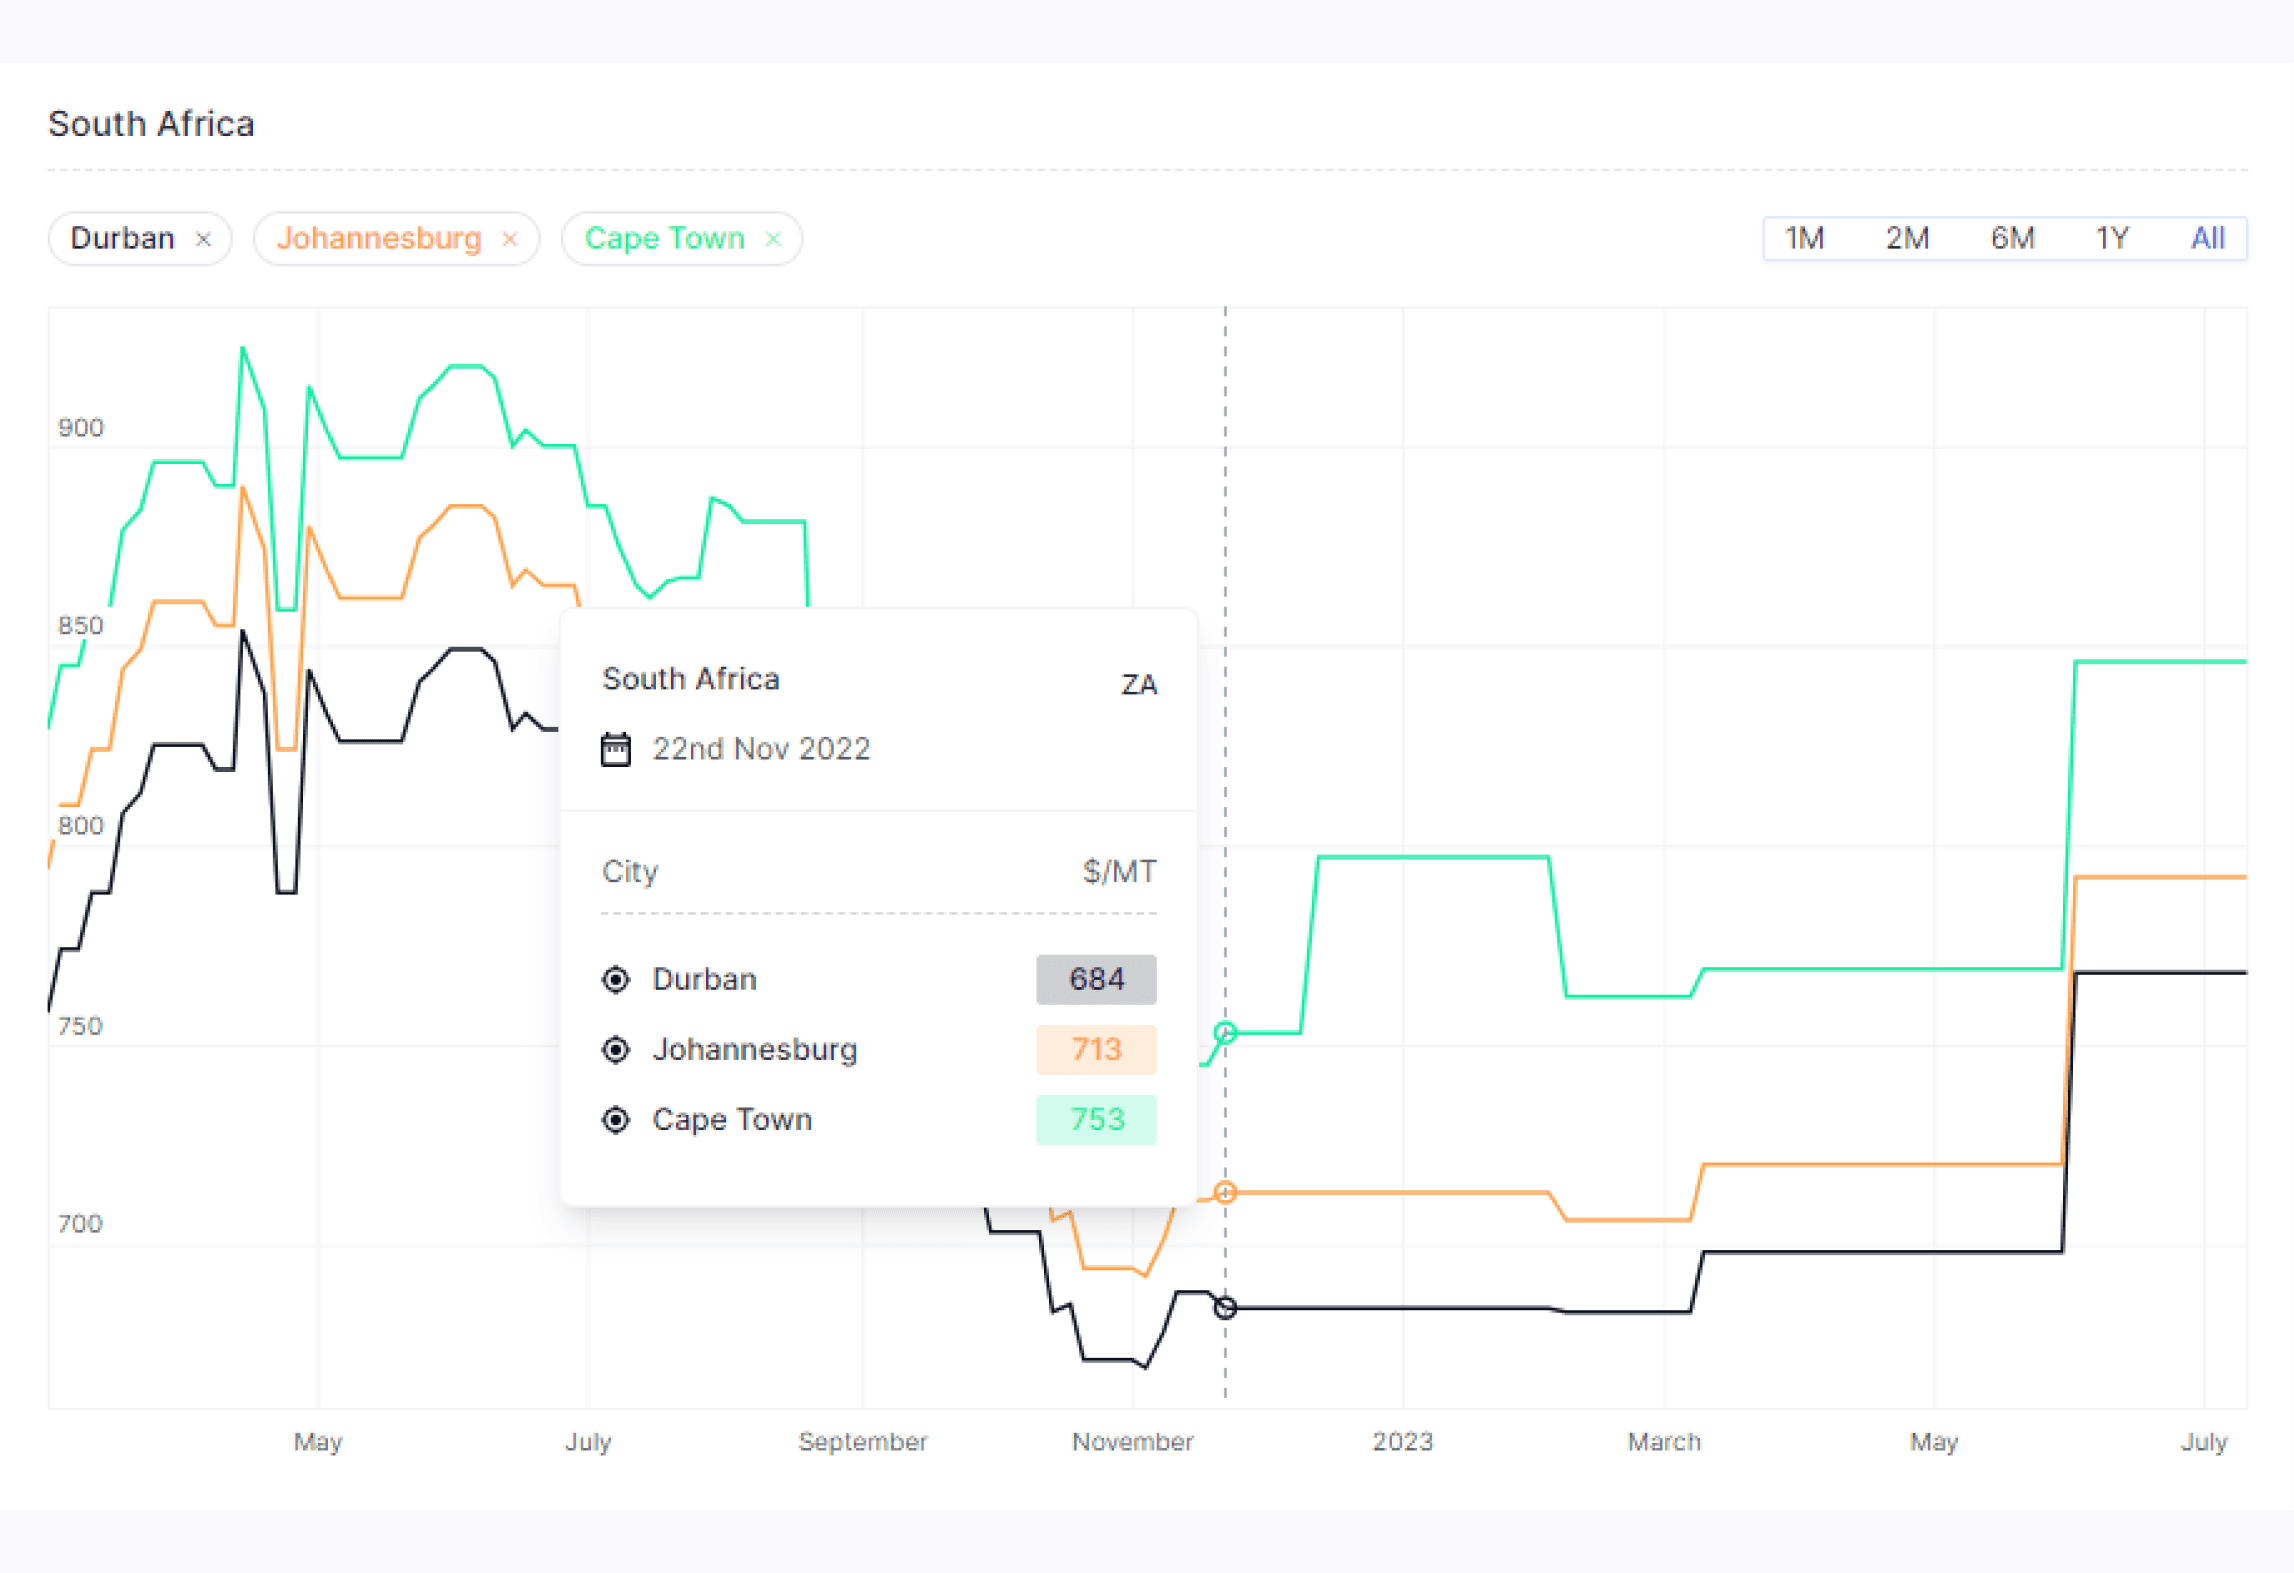
Cape Town
South Africa
769$/MT
1M

Analyze and compare price trends between different cities
Track, analyze and compare the prices across different cities plotted on a graph that is updated in real-time.
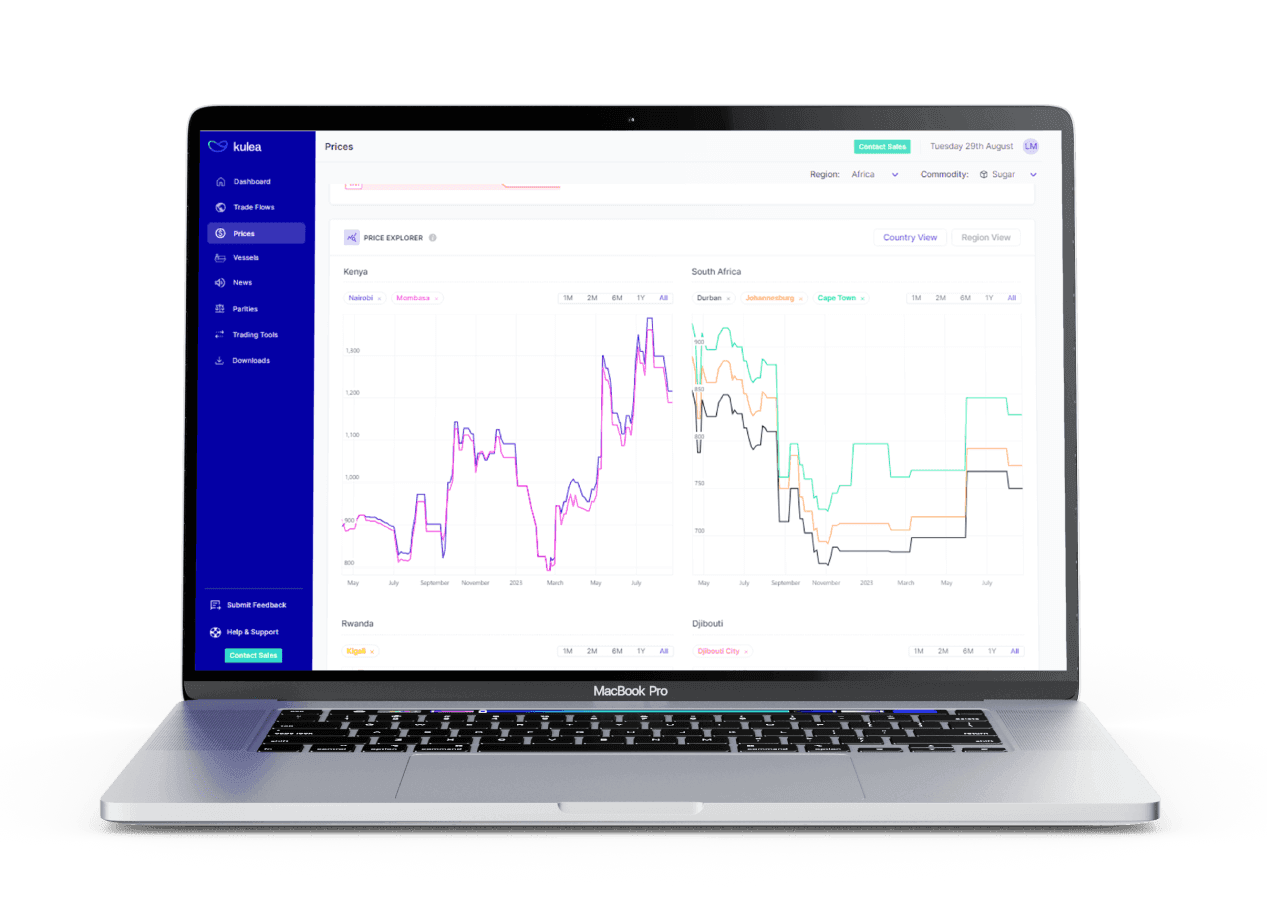
View historical pricing data and mark commodities risk to market.
The Kulea pricing index gives you price history going back years to give you a clear picture of price trajectory in various regions.